|
libwebsockets
Lightweight C library for HTML5 websockets
|
|
libwebsockets
Lightweight C library for HTML5 websockets
|
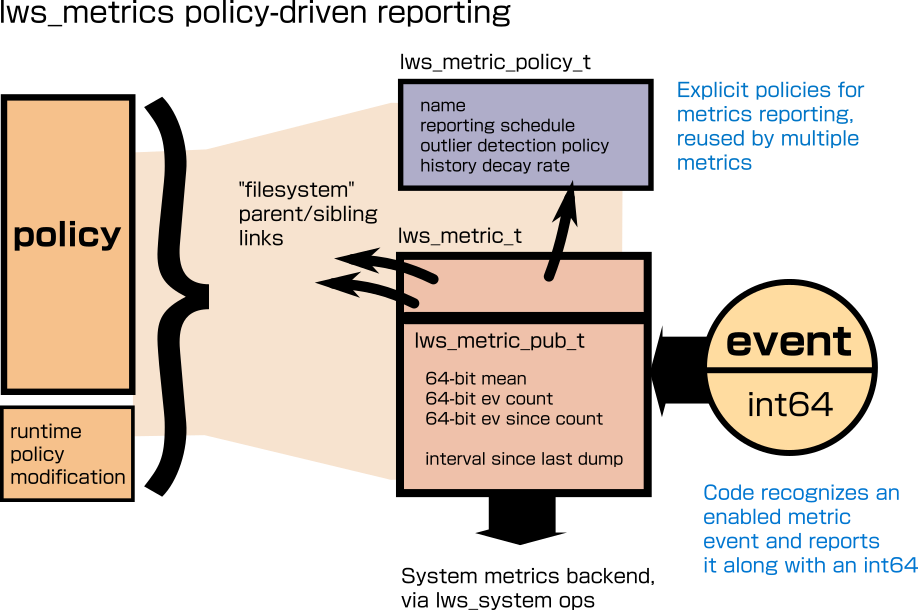
lws_metrics lws_metrics records and aggregates events at all lws layers.
There are three distinct parts:
info.metrics_policies.The external backend interface code may itself make use of lws connectivity apis including Secure Streams itself, and lws metrics are available on that too.
Normally metrics implementations are fixed at build-time and cannot change without a coordinated reflash of devices along with a change of backend schema.
lws_metrics separates out the objects and code necessary to collect and aggregate the data cheaply, and the reporting policy that controls if, or how often, the results are reported to the external handler.

Metrics are created with a namespace name and the policy applies itself to those by listing the names, with wildcards allowed, the policy applies to, eg if specified in the Secure Streams JSON policy
Metrics that do not have a reporting policy do not report, but continue to aggregate measurements in case they are bound to a policy dynamically later.
There is no predefined metrics schema, metrics objects, including those created by applications, can independently choose their own name in a namespace like "cpu.srv" or "n.cn.dns", and can set a prefix for all metrics names created in a context (by setting info.metrics_prefix at context creation time).
This allows multiple processes in a single device to expose copies of the same metrics in an individually addressable way, eg, if the UI process specifies the prefix "ui", then its lws metrics like "cpu.srv" will actually be created as "ui.cpu.srv".
Applications can freely define their own lws_metrics measurements with their own names in the namespace too, without central registration, and refer to those names in the reporting policy same as any other metric names.
If the metrics backend requires a fixed schema, the mapping between the lws_metrics names and the backend schema indexes will be done in the lws_system external reporting api implementation alone. Metrics objects contain a void * backend_opaque that is ignored by lws and can be set and read by the external reporting handler implementation to facilitate that.
Histogram metrics track differently-qualified results in the same metric, for example the metric n.cn.failures maintains separate result counts for all variations and kinds of failure.
The user handler for metrics is expected to iterate these, in the provided examples (eg, minimal-secure-streams-testsfail)
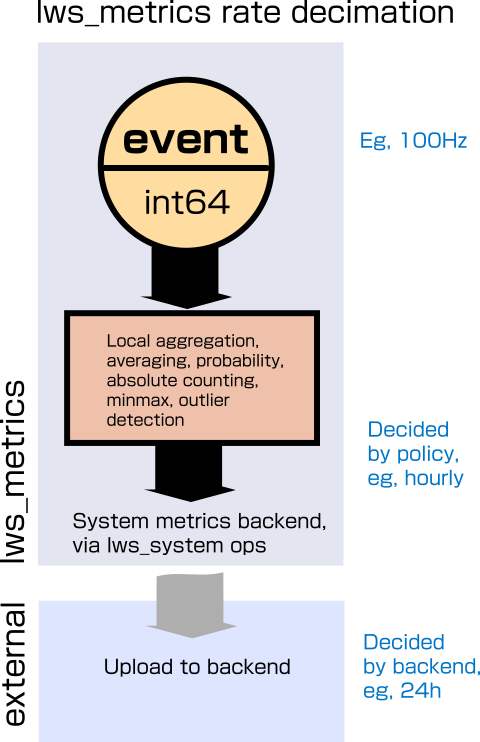
Event information can easily be produced faster than it can be transmitted, or is useful to record if everything is working. In the case that things are not working, then eventually the number of events that are unable to be forwarded to the backend would overwhelm the local storage.
For that reason, the metrics objects are designed to absorb and summarize a potentially large number of events cheaply by aggregating them, so even extreme situations can be tracked meaningfully inbetween dumps to the backend.
There are two approaches:
A single metric aggregation object has separate "go / no-go" counters, since most operations can fail, and failing operations act differently.
lws_metrics 'aggregation' supports decimation by

In addition, the policy defines a percentage variance from the mean that optionally qualifies events to be reported individually.
The lws_metrics 'histogram' allows monitoring of different outcomes to produce counts of each outcome in the "bucket".
When the metrics object is created, flags are used to control how it will be used and consumed.
For example to create a histogram metrics object rather than the default aggregation type, you would give the flag LWSMTFL_REPORT_HIST at creation time.
| Flag | Meaning |
|---|---|
LWSMTFL_REPORT_OUTLIERS | track outliers and report them internally |
LWSMTFL_REPORT_OUTLIERS_OOB | report each outlier externally as they happen |
LWSMTFL_REPORT_INACTIVITY_AT_PERIODIC | explicitly externally report no activity at periodic cb, by default no events in the period is just not reported |
LWSMTFL_REPORT_MEAN | the mean is interesting for this metric |
LWSMTFL_REPORT_ONLY_GO | no-go pieces invalid and should be ignored, used for simple counters |
LWSMTFL_REPORT_DUTY_WALLCLOCK_US | the aggregated sum or mean can be compared to wallclock time |
LWSMTFL_REPORT_HIST | object is a histogram (else aggregator) |
lws creates and maintains various well-known metrics when you enable build with cmake -DLWS_WITH_SYS_METRICS=1:
| metric name | scope | type | meaning |
|---|---|---|---|
cpu.svc | context | monotonic over time | time spent servicing, outside of event loop wait |
n.cn.dns | context | go/no-go mean | duration of blocking libc DNS lookup |
n.cn.adns | context | go/no-go mean | duration of SYS_ASYNC_DNS lws DNS lookup |
n.cn.tcp | context | go/no-go mean | duration of tcp connection until accept |
n.cn.tls | context | go/no-go mean | duration of tls connection until accept |
n.http.txn | context | go (2xx)/no-go mean | duration of lws http transaction |
n.ss.conn | context | go/no-go mean | duration of Secure Stream transaction |
n.ss.cliprox.conn | context | go/no-go mean | time taken for client -> proxy connection |
vh.[vh-name].rx | vhost | go/no-go sum | received data on the vhost |
vh.[vh-name].tx | vhost | go/no-go sum | transmitted data on the vhost |
| metric name | scope | type | meaning |
|---|---|---|---|
n.cn.failures | context | histogram | Histogram of connection attempt failure reasons |
| Bucket name | Meaning |
|---|---|
tls/invalidca | Peer certificate CA signature missing or not trusted |
tls/hostname | Peer certificate CN or SAN doesn't match the endpoint we asked for |
tls/notyetvalid | Peer certificate start date is in the future (time wrong?) |
tls/expired | Peer certificate is expiry date is in the past |
dns/badsrv | No DNS result because couldn't talk to the server |
dns/nxdomain | No DNS result because server says no result |
The lws-minimal-secure-streams example is able to report the aggregated metrics at the end of execution, eg
lws-minimal-secure-stream-testsfail which tests various kinds of connection failure reports histogram results like this
Openmetrics https://tools.ietf.org/html/draft-richih-opsawg-openmetrics-00 defines a textual metrics export format comaptible with Prometheus. Lws provides a protocol plugin in ./plugins/protocol_lws_openmetrics_export that enables direct export for prometheus scraping, and also protocols to proxy openmetrics export for unreachable servers.